Market Outlook
March 15, 2018
Market Cues
Domestic Indices
Chg (%)
(Pts)
(Cl ose)
Indian markets are likely to open negative tracking global indices and SGX Nifty.
BSE Sensex
(0.2)
(61)
33,857
U.S. stocks fell sharply during the last trading session, accelerating to the downside
Nifty
0.1
5
10,427
after a relatively upbeat start to the session. The Dow Jones slipped to 1.0% to close
Mid Cap
1.0
161
16,269
at 24,758. The NASDAQ dropped down by 0.2% to close at 7,497.
Small Cap
1.1
199
17,602
U.K. stocks finished down slightly the last trading session, tracking losses in the U.S.
Bankex
0.4
121
27,905
that came as trade-war fears helped send industrial shares lower. The FTSE 100 was
down by 0.1% to end at 7,133.
Global Indices
Chg (%)
(Pts)
(Cl ose)
On domestic front, Indian shares opened lower as trade tensions between the U.S.
Dow Jones
(1.0)
(249)
24,758
and China intensified and Punjab National Bank said it has uncovered additional
Nasdaq
(0.2)
(14)
7,497
exposure of about Rs 942cr to Gitanjali Group under consortium lending. The BSE
FTSE
(0.1)
(6)
7,133
Sensex ended down by 0.2% at 33,857.
Nikkei
(0.6)
(128)
21,649
News Analysis
Hang Seng
(0.1)
(22)
31,413
World Bank projects 7.3% growth for India in FY19 and 7.5% in FY20
Shanghai Com
(0.1)
(4)
3,288
Detailed analysis on Pg2
A dvances / Declines
BSE
NSE
Investor’s Ready Reckoner
Advances
1,279
868
Key Domestic & Global Indicators
Declines
1,423
896
Stock Watch: Latest investment recommendations on 150+ stocks
Unchanged
155
76
Refer Pg5 onwards
Top Picks
Volumes (` Cr)
C MP
Target
U psi de
C ompany
Sector
R ating
BSE
3,388
(`)
(`)
(%)
Alkem Laboratories
Pharmaceuticals Accumulate
2,197
2,441
11.1
NSE
27,629
Blue Star
Capital Goods Accumulate
797
867
8.8
Dewan Housi ng Finance
Financials
Buy
522
720
38.0
Net Inflows (` Cr)
Ne t
Mtd
Ytd
Karur Vysya Bank
Financials
Buy
102
160
57.5
FII
4,935
8,340
8,833
KEI Industrie s
Capital Goods
Buy
372
436
17.3
*MFs
(273)
(455)
24,750
More Top Picks on Pg4
Key Upcoming Events
Top Gainers
Price (`)
Chg (%)
Previous
C onsensus
D ate
Region
Event Description
Reading
Expectations
IDBI
74
10.2
Mar 15
India
Imports YoY%
26.10
JPASSOCIAT
16
9.4
Mar 15
US
Initial Jobless claims
231.00
227.50
JAICORPLTD
141
7.4
Mar 15
India
Exports YoY%
9.10
DISHTV
71
7.2
Mar 16
US
Housi ng Starts
1,326.00
1,290.00
Mar 16
Euro Zone
Euro-Zone CPI (YoY)
1.20
1.20
ORIENTBANK
101
6.1
More Events on Pg7
Top Losers
Price (`)
Chg (%)
IIFL
814
(4.3)
GDL
205
(3.9)
DEEPAKFERT
323
(3.8)
IBVENTURES
260
(3.8)
BBTC
1,293
(3.7)
As on March 14, 2018
Market Outlook
March 15, 2018
News Analysis
World Bank projects 7.3% growth for India in FY19 and 7.5% in FY20
The World Bank projected India's GDP growth at 7.3 per cent for the next financial
year and accelerates further to 7.5 per cent in 2019-20. The report, however,
observed that a growth of over 8 per cent will require "continued reform and a
widening of their scope" aimed at resolving issues related to credit and investment,
and enhancing competitiveness of exports.
"The Indian economy is likely to recover from the impact of demonetization and
the GST, and growth should revert slowly to a level consistent with its proximate
factors - that is, to about 7.5 per cent a year". The World Bank report further said
that accelerating the growth rate will also require continued integration into global
economy.
Economic and Political News
Government approves Rs 64.41bn road projects under SARDP programme
for Nagaland
Hindustan Unilever's GST benefit deposit offer to Government touches Rs
1.55bn
Government released Rs 125bn to Andhra as special assistance
Corporate News
Tata Teleservices plans to close CDMA service in Delhi from March 19
ITI Ltd to have Rs 100-bn order book by March-end
Wipro to divest hosted data centre services business to Ensono for $405mn
Strides Shasun gets US FDA approval for HIV treatment drug Efavirenz
Market Outlook
March 15, 2018
Top Picks
Market Cap
C MP
Target
Upside
C ompany
R ationale
(` Cr)
(`)
(`)
(%)
Strong growth in domestic business due to its
leadership in acute therapeutic segment. Alkem
Alkem Laboratories
26,270
2,193
2,441
11.1
expects to launch more products in USA, which bodes
for its international business.
Favorable outlook for the AC industry to augur well for
Cooling products busine ss which is out pacing the
Blue Star
7,591
797
867
9.6
market growth. EMPPAC division's profitability to
improve once operating environment turns around.
With a focus on the low and medium income (LMI)
consumer segment, the company has increased its
Dewan Housi ng Finance
16,189
521
720
39.5
presence in tier-II & III cities where the growth
opportunity i s immense.
Well capitalized with CAR of
18.1% which give s
sufficient room to grow asset base. Faster resolution of
ICICI Bank
195,338
306
416
36.6
NPA would reduce provision cost, which would help to
report better ROE.
High order book execution in EPC segment, rising B2C
KEI Industrie s
2,896
371
436
18.0
sales and higher exports to boost the revenues and
profitability
Expected to benefit from the lower capex requirement
Music Broadcast Limited
2,166
378
475
25.1
and 15 ye ar long radio broadcast licensing.
Massive capacity expansion along with rail advantage
Navkar Corporation
2,389
157
265
67.0
at ICD as well CFS augur well for the company
Strong brands and distribution network would boost
Siyaram Silk Mills
2,961
628
851
34.7
growth going ahead. Stock currently trade s at an
inexpensive valuation.
Market leadership in Hi ndi news genre and no.
2
viewership ranking in English news genre, exit from the
TV Today Network
2,718
535
508
11.5
radio business, and anticipate d growth i n ad spends
by corporate to benefit the stock.
After GST, the company is expected to see higher
volume s along with improving product mix. The
Maruti
2,64,426
8,839
10,619
21.3
Gujarat plant will also e nable higher operating
leverage which will be margin accretive.
We expect loan book to grow at 24.3% over next two
GIC Housing
2,139
396
655
64.9
year; change in borrowing mix will help in NIM
improve ment
We expect CPIL to report net Revenue/PAT CAGR of
~17%/ 16% over FY2017-20E mainly due to he althy
Century Plyboards
7,253
322
400
22.5
growth in plywood & lamination busi ness, forayed into
MDF & Particle boards on back of strong brand &
distribution network.
We expect sales/PAT to grow at 13.5%/20% over next
LT Foods
2,765
86
128
48.1
two years on the back of strong distribution network &
addition of new products in portfolio.
Third largest brand pl ay in luggage segment Increased
product offerings and improving distri bution network is
Safari Industries
1,181
531
650
22.4
leading to strong growth in business. Likely to post
robust growth for next 3-4 years
We expect HSIL to report PAT CAGR of ~15% over
FY2017-20E owing to better improve ment in operating
HSIL Ltd
2,969
405
510
24.2
margin due price hike in container glass segment,
turnaround in consumer business.
We expect financialisation of savings and increasing
Aditya Birla Capital
33728
151
218
41.5
penetration in Insurance & Mutual fund would ensure
steady growth.
Source: Company, Angel Research
Market Outlook
March 15, 2018
Fundamental Call
Market Cap
C MP
Target
Upside
C ompany
R ationale
(` Cr)
(`)
(`)
(%)
CCL is likely to maintain the strong growth trajectory
CCL Products
3,882
292
360
23.4
over FY18-20 backed by capacity expansi on and new
geographical foray
We forecast Nilkamal to report top-line CAGR of ~9%
to `2,635cr over FY17-20E on the back of healthy
Nilkamal
2,510
1,682
2,178
29.5
demand growth in pl astic division. On the bottom -line
front, we estimate ~10% CAGR to `162cr owing to
improve ment in volumes.
We expect sales/PAT to grow at 9%/ 14% over next two
years on the back of healthy demand growth in
Shreyans Industries
191
138
247
79.2
printing. Further, China had banned maki ng paper
from waste pulp which would benefit Indian paper
companie s.
The prism has diversified exposure in the different
segment such as Cement, Tile & ready mix concrete.
Prism Cement
5,932
118
160
35.8
Thus we believe, PCL is in the right place to capture
ongoing government spendi ng on affordable housing
and infrastructure projects.
Elantas Beck India is the Indian market leader in liquid
insulation segment use d in electrical equipments like
Elantas Beck India Ltd
1,614
2,036
2,500
22.8
motors, transformers etc. It derives demand from
several industries which are expected to register 10%+
CAGR in demand in the coming years.
RPL to report healthy top-line CAGR of ~13% over
FY17-20E on the back of healthy de mand in printing &
Ruchira Papers Ltd.
378
169
244
44.6
writing paper segments. On the bottom-line front, we
estimate ~16% CAGR over FY17-20E owing to strong
improve ment in operating performance.
Greenply Industries Ltd (GIL) manufactures plywood &
allied products and medium density fibreboards
(MDF). GIL to report net reve nue CAGR of ~14% to
Greenply Industries
3,998
326
395
21.2
~`2,478cr over F Y2017-20E mainly due to healthy
growth in plywood & lamination busine ss on the back
of strong brand and di stribution network
Source: Company, Angel Research
Market Outlook
March 15, 2018
Key Upcoming Events
Global economic events release calendar
Bl oomberg Data
D ate
Time
C ountry
Event Description
Unit
Period
L ast Reporte d
E stimate d
Mar 15, 2018
12: 00 PM India
Monthly Wholesale Prices YoY%
% Change
Feb
2.84
2.50
6:00 PM US
Initial Jobless claims
Thousands
Mar 10
231.00
227.50
US
Producer Price Index (mom)
% Change
Feb
0.70
India
Imports YoY%
% Change
Feb
26.10
6:45 PM US
Industrial Production
%
Feb
(0.05)
0.40
Mar 16, 2018
India
Exports YoY%
% Change
Feb
9.10
3:30 PM Euro Zone
Euro-Zone CPI (YoY)
%
Feb F
1.20
1.20
6:00 PM US
Housi ng Starts
Thousands
Feb
1,326.00
1,290.00
6:00 PM US
Building permits
Thousands
Feb
1,377.00
1,320.00
Mar 20, 2018
8:30 PM Euro Zone
Euro-Zone Consumer Confidence
Value
Mar A
0.10
3:00 PM UK
CPI (YoY)
% Change
Feb
3.00
Mar 21, 2018
7:30 PM US
Existing home sales
Million
Feb
5.38
5.42
3:00 PM UK
Joble ss claims change
% Change
Feb
(7.20)
11: 30 PM US
FOMC rate decision
%
Mar 21
1.50
1.75
Mar 22, 2018
2:00 PM Germany
PMI Services
Value
Mar P
55.30
2:00 PM Germany
PMI Manufacturing
Value
Mar P
60.60
7:30 PM US
New home sales
Thousands
Feb
593.00
617.50
Mar 23, 2018
5:30 PM UK
BOE Announce s rate s
% Ratio
Mar 22
0.50
Mar 27, 2018
7:30 PM US
Consumer Confidence
S.A./ 1985=100
Mar
130.80
Mar 28, 2018
6:00 PM US
GDP Qoq (Annualise d)
% Change
4Q T
2.50
Mar 29, 2018
1:25 PM Germany
Unempl oyment change (000's)
Thousands
Mar
(22.00)
2:00 PM UK
GDP (YoY)
% Change
4Q F
1.40
Mar 31, 2018
6:30 AM China
PMI Manufacturing
Value
Mar
50.30
Apr 03, 2018
2:00 PM UK
PMI Manufacturing
Value
Mar
55.20
Source: Bloomberg, Angel Research
Market Outlook
March 15, 2018
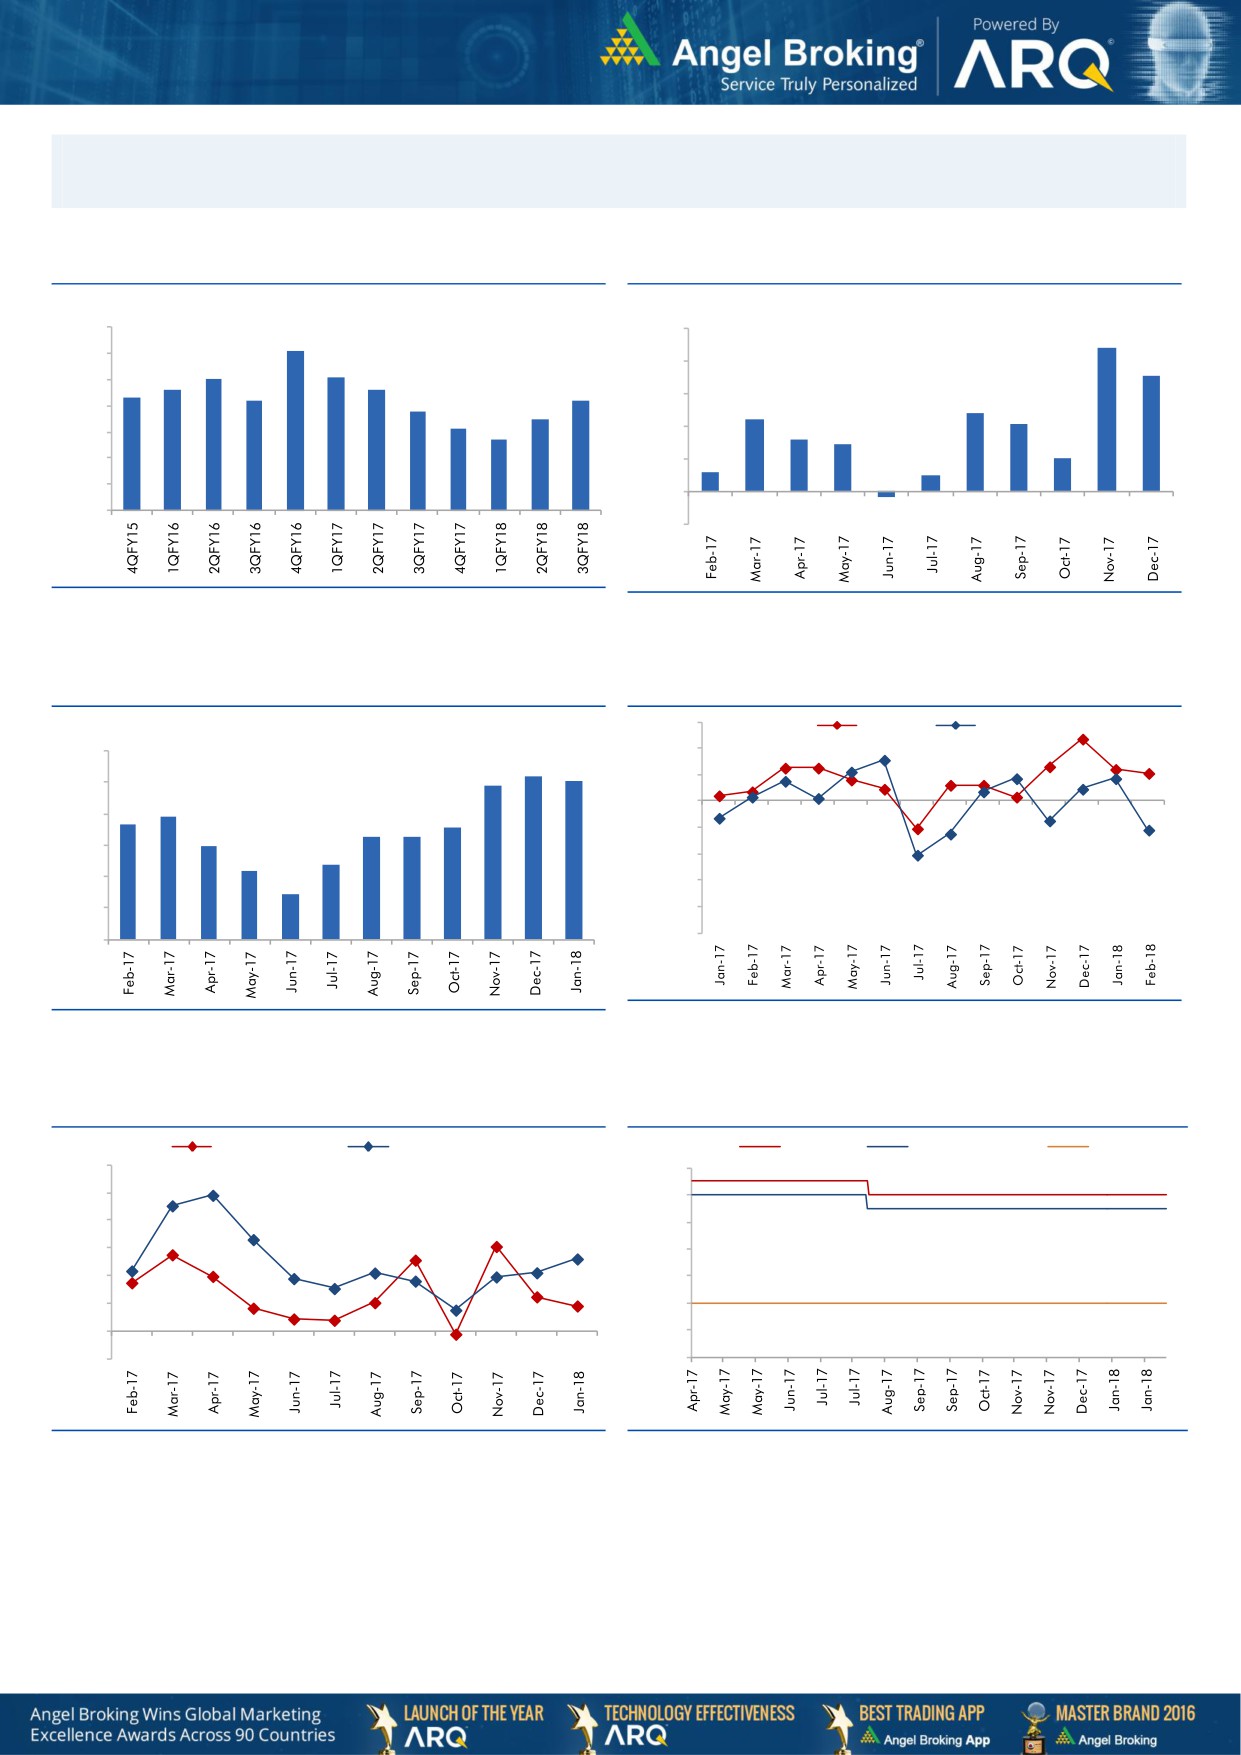
Macro watch
Exhibit 1: Quarterly GDP trends
Exhibit 2: IIP trends
(%)
(%)
10.0
10.0
9.1
8.8
9.0
8.0
8.1
8.0
7.1
7.6
7.6
8.0
7.3
7.2
7.2
6.8
6.0
4.8
7.0
6.5
4.4
6.1
4.1
5.7
4.0
3.2
2.9
6.0
2.0
5.0
2.0
1.2
1.0
4.0
-
3.0
(0.3)
(2.0)
Source: CSO, Angel Research
Source: MOSPI, Angel Research
Exhibit 3: Monthly CPI inflation trends
Exhibit 4: Manufacturing and services PMI
56.0
Mfg. PMI
Services PMI
(%)
6.0
54.0
5.2
5.1
4.9
52.0
5.0
3.9
50.0
3.7
3.6
4.0
3.3
3.3
3.0
48.0
3.0
2.4
2.2
46.0
2.0
1.5
44.0
1.0
42.0
40.0
-
Source: Market, Angel Research; Note: Level above 50 indicates expansion
Source: MOSPI, Angel Research
Exhibit 5: Exports and imports growth trends
Exhibit 6: Key policy rates
(%)
Exports yoy growth
Imports yoy growth
(%)
Repo rate
Reverse Repo rate
CRR
60.0
6.50
50.0
6.00
40.0
5.50
30.0
5.00
20.0
4.50
10.0
4.00
0.0
3.50
(10.0)
3.00
Source: Bloomberg, Angel Research
Source: RBI, Angel Research
Market Outlook
March 15, 2018
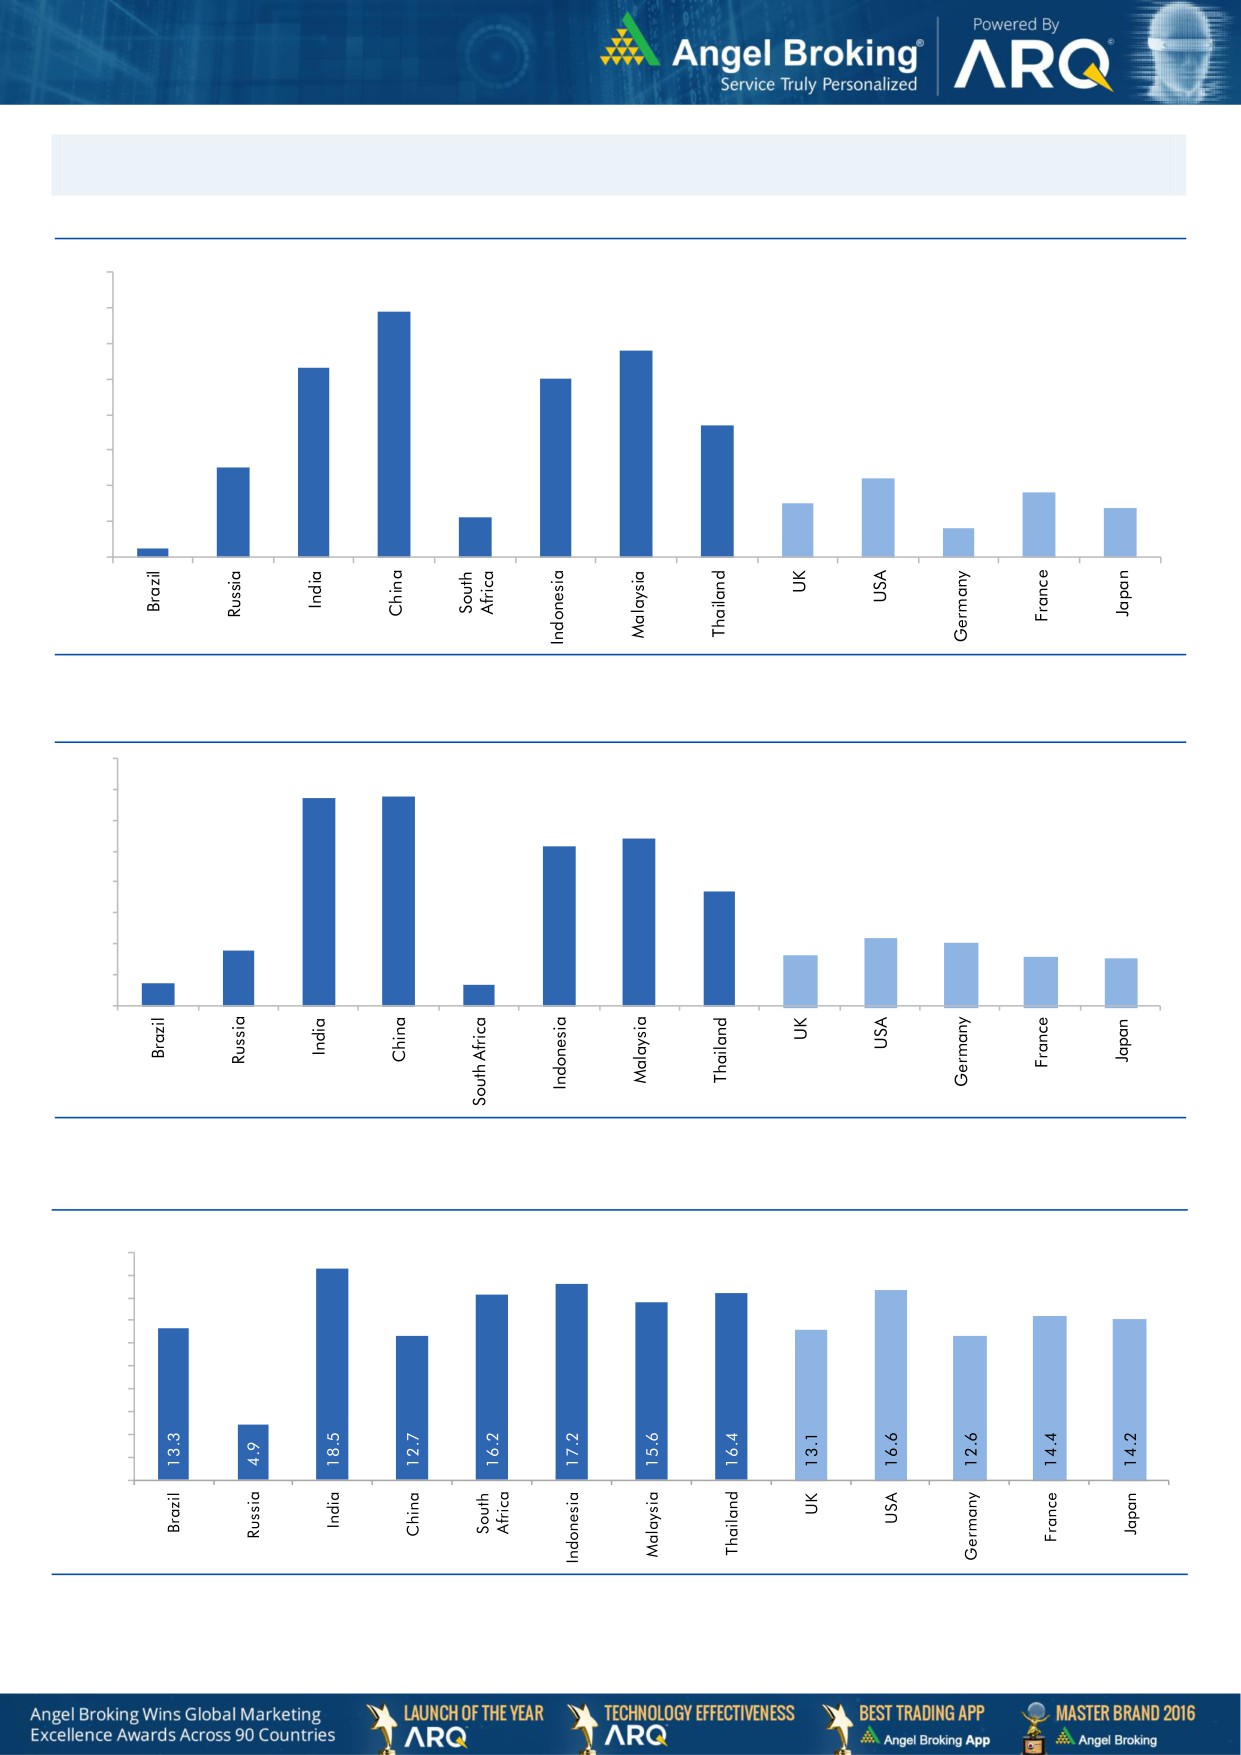
Global watch
Exhibit 1: Latest quarterly GDP Growth (%, yoy) across select developing and developed countries
(%)
8.0
6.9
7.0
5.8
6.0
5.3
5.0
5.0
1.1
3.7
4.0
2.5
3.0
2.2
1.8
2.0
1.5
1.4
0.8
1.0
0.3
-
Source: Bloomberg, Angel Research
Exhibit 2: 2017 GDP Growth projection by IMF (%, yoy) across select developing and developed countries
(%)
6.7
6.8
7.0
6.0
5.4
5.2
5.0
3.7
4.0
3.0
1.8
2.2
2.0
1.7
1.6
2.0
0.7
1.5
0.7
1.0
-
Source: IMF, Angel Research
Exhibit 3: One year forward P-E ratio across select developing and developed countries
(x)
20.0
18.0
16.0
14.0
12.0
10.0
8.0
6.0
4.0
2.0
-
Source: IMF, Angel Research
Market Outlook
March 15, 2018
Exhibit 4: Relative performance of indices across globe
Returns (%)
C ountry
Name of index
Closing price
1M
3M
1YR
Brazil
Bovespa
86,051
5.5
17.4
30.9
Russia
Micex
2,275
2.2
8.2
13.7
India
Nifty
10,411
(1.6)
1.4
16.6
China
Shanghai Composite
3,291
(2.5)
0.4
1.4
South Africa
Top 40
51,789
4.5
0.2
15.5
Mexico
Mexbol
48,156
0.7
1.2
2.3
Indonesia
LQ45
1,051
(5.1)
2.2
16.6
Malaysia
KLCI
1,857
2.0
8.0
7.5
Thailand
SET 50
1,195
3.5
8.6
22.5
USA
Dow Jones
24,758
2.3
1.8
18.2
UK
FTSE
7,133
(0.6)
(4.3)
(3.8)
Japan
Nikkei
21,777
1.8
(3.2)
12.6
Germany
DAX
12,238
(0.4)
(6.8)
1.9
France
CAC
5,233
1.8
(2.8)
4.4
Source: Bloomberg, Angel Research p68in4